
Logs and monitoring
Two administrator apps show what the box is doing: the Log Center (messages from the daemon, the system and apps) and the Resource Monitor (CPU, memory, network, disks and temperatures). Notifications reach people in the desktop only; there is no email or push.
The Log Center
Section titled “The Log Center”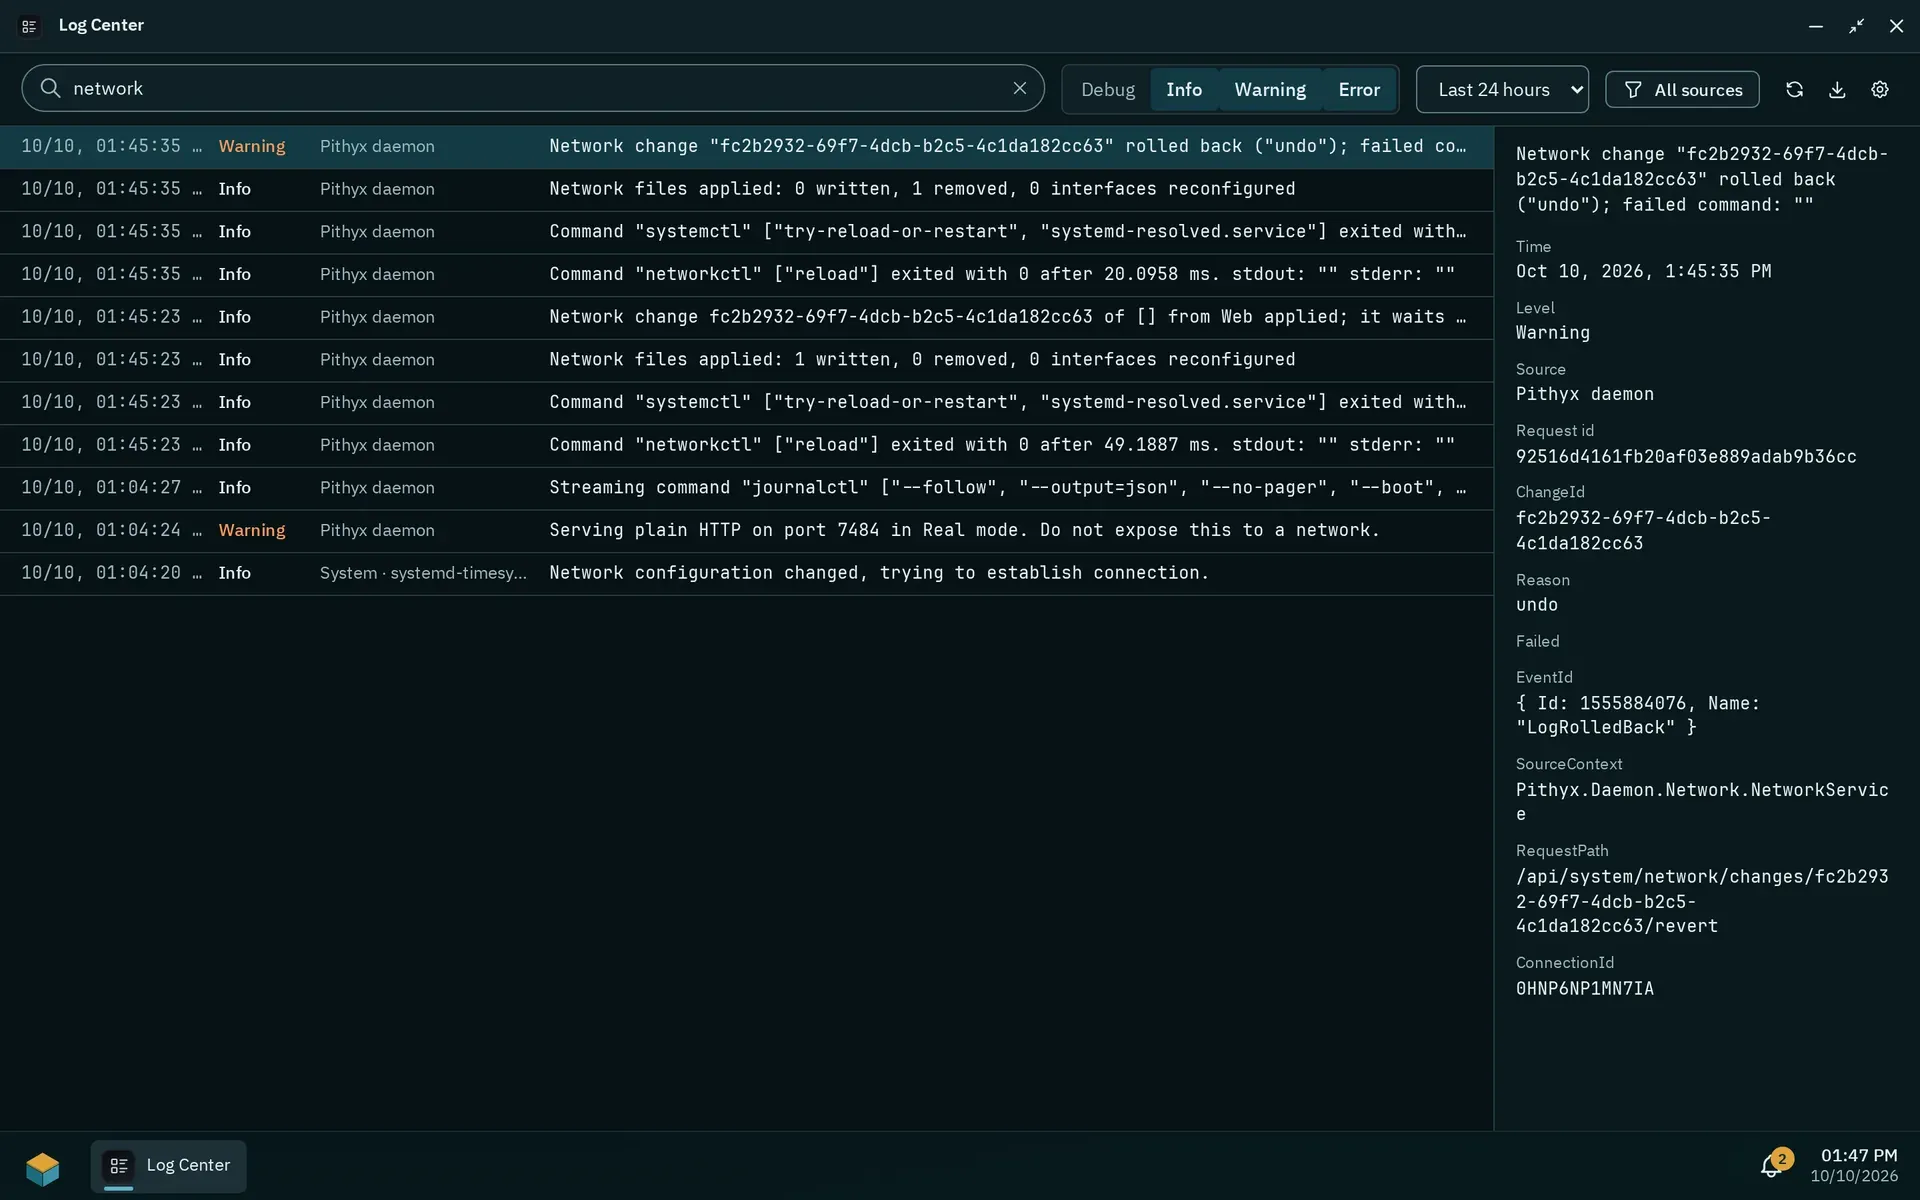
The Log Center with a search, level and time filters and the details of the selected entry.
The Log Center lets you search messages or a request id and filter by Levels (Debug, Info, Warning, Error), by time range (last hour, 24 hours, 7 days, 30 days, all time) and by source: “Pithyx daemon”, “System · {name}” for journal units (kernel, Samba, SSH, ZFS, systemd-networkd, timesyncd, Docker, smartmontools and others) and “App · {name}”. The details show time, level, source, user, request id and whether the entry is in the archive. Pages hold 200 entries by default, at most 1000. Export as text (.log) and Export as JSON lines (.jsonl) write up to 1 000 000 entries.
Logs are stored in a database on the system disk under /var/log/pithyx/, so they work without a pool. Retention is set with Retention: keep 30 days by default (1 to 365) and at most 4 GB (64 MB to 4 GB); the oldest entries go first. The optional archive on a pool is off by default. When on, entries are copied to the pool once a day and before the current logs drop any, which wakes the pool’s disks about once a day. Archive days: 1 to 3650 (default 365); size 0.25 to 1024 GB (default 10 GB). If the pool is unavailable, entries wait on the system disk.
The daemon also writes JSON files /var/log/pithyx/daemon.json*, rolling at 20 MB with 10 files. Secrets are masked in logs.
App messages arrive through the SDK: info, warn and error always, debug only while an administrator turned it on in the app’s detail. A message is at most 4000 characters, with at most 20 data fields; an app may log 20 messages per second (burst 200). Backend container output lands in the source app/<id>. A line on stdout is info, a line on stderr a warning, and a line that is a JSON object with a string level (debug or trace, info, warn or warning, error, fatal or critical) keeps that level. Such a JSON line shows its message (or msg) as the message and its other fields (at most 32, each cut to 1024 characters) as data; a W3C traceparent field ties it to the request, so searching the request id finds it next to the daemon’s lines. A debug line is kept only while an administrator turned debug messages on for the app.
The Resource Monitor
Section titled “The Resource Monitor”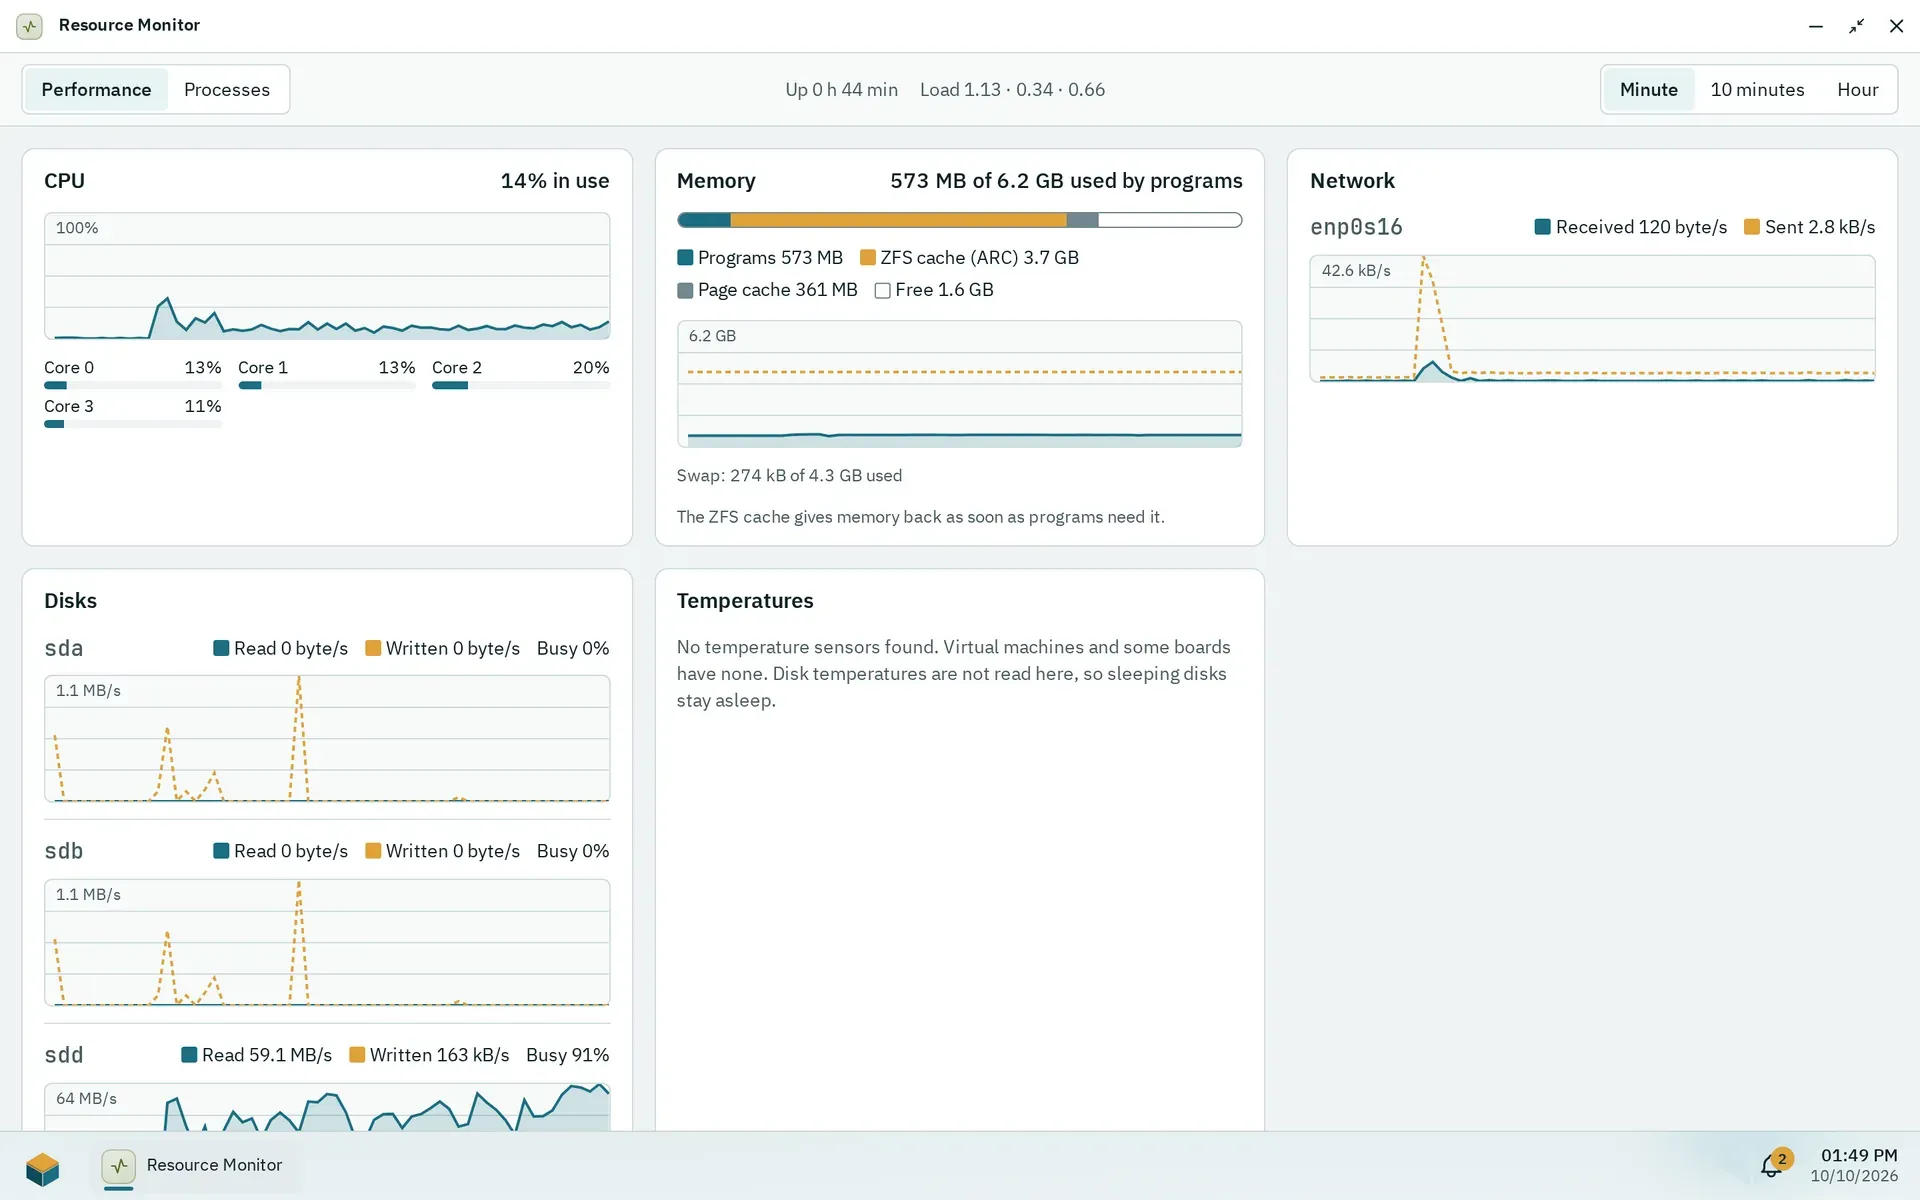
The Performance view of the last minute, here during a scrub.
The Resource Monitor has the views Performance and Processes, with time ranges of a minute, 10 minutes and an hour. It samples every second, and only while someone watches it; the history is kept in memory for one hour. So the history covers only the time the monitor was open somewhere: nothing is measured while nobody watches.
It shows CPU in total and per core, and memory split into Programs, ZFS cache (ARC), Page cache and Free, plus swap. The ZFS cache gives memory back as soon as programs need it. Network traffic is shown per interface, disk reads, writes and busy time per disk (from the kernel’s counters, so a sleeping disk stays asleep), and temperatures from the sensors; disk temperatures are not read here. The process list shows name, PID, user, CPU (share of all cores together) and memory, with a filter. Settings > Info Center shows version, host name, kernel, CPU, memory and uptime.
Notifications
Section titled “Notifications”Each user has a list in the desktop (up to 200 entries, kept 30 days). Administrators get storage alerts (degraded or faulted pools, missing disks, data errors, 80 and 90 percent full, failing SMART values), job results, and the Store notices “App updates” and “Catalog not fetched”. Apps with the permission to show notifications can post to the user who uses them.